Electronic sphygmomanometer system designed based on oscillometric method
Electronic sphygmomanometer system designed based on oscillometric method
This article introduces the design method of the electronic sphygmomanometer using LM3S1138 as the control core and pressure sensor MPXV505GP as the signal collector.
The domesticization of medical testing equipment has gradually become a trend, in which home sphygmomanometers are typical household medical testing equipment. At present, the most commonly used sphygmomanometer is the mercury sphygmomanometer, which is difficult for ordinary users, especially middle-aged and elderly people. In the past, people had to go to the hospital to measure blood pressure, which was very inconvenient. The sphygmomanometer with accurate measurement, simple operation and convenient carrying is helpful for people to find and identify various blood pressure disorders as soon as possible and seek medical treatment in time. The electronic sphygmomanometer has the advantages of low cost, miniaturization, low power consumption, and high degree of automation. It brings the characteristics of portability and easy operation in use, and makes up for the shortcomings of the mercury sphygmomanometer.
1 Principle of oscilloscope
The oscillometric method is also called the pressure oscillation method. Its working process is to inflate the cuff to block the arterial blood flow, and then to detect the gas pressure in the cuff and extract the weak pulse wave during the deflation process. As shown in Figure 1, when the cuff pressure P is much higher than the systolic pressure, the pulse wave disappears, and as the cuff pressure decreases, the pulse begins to appear. When the cuff pressure drops from above the systolic pressure to below the systolic pressure Ps, the pulse wave will suddenly increase, and the amplitude will reach its maximum at the average pressure Pm. The pulse wave then attenuates as the cuff pressure drops. Oscillometric blood pressure measurement estimates blood pressure based on the relationship between pulse wave amplitude and cuff pressure. The maximum value of the pulse wave corresponds to the average pressure, and the systolic pressure Ps and the diastolic pressure Pd are determined by the ratio of the corresponding maximum amplitude of the pulse wave. 
When measuring blood pressure, as the cuff pressure drops, the blood vessel changes from blocking to conduction, a process that produces a series of small pulses in the cuff. Pick up the small pulse and connect its peak into a curve to get the envelope, as shown in Figure 2. 
There are many specific methods for determining systolic and diastolic blood pressure using the oscillometric method, which can be summarized into two types: waveform characteristic method and amplitude coefficient method. The basic principle of the waveform feature method is to use the inflection point of the pulse wave envelope to measure blood pressure. The static pressure corresponding to the inflection point when rising is systolic pressure, and the static pressure corresponding to the inflection point when falling is diastolic pressure. This method has poor individual adaptability and unstable measurement accuracy, which has been gradually replaced by the amplitude coefficient method.
The amplitude coefficient method is also called "normalization method". It compares the amplitude of the pulse wave vibration signal with the maximum amplitude of the signal and normalizes it to identify the systolic and diastolic pressures by identifying the normalized coefficients of systolic and diastolic pressure, as shown in Figure 3. Where As is the amplitude of the pulse wave corresponding to systolic pressure, Am is the amplitude of the pulse wave corresponding to average pressure, Ad is the amplitude of the pulse wave corresponding to diastolic pressure, As / Am is the normalized value of systolic pressure Pd, Ad / Am It is the normalized value of the diastolic pressure Ps, Pc is the cuff pressure, and the abscissa represents the decreasing pressure in the cuff during deflation. As / Am = C1, Ad / Am = C2, respectively corresponding to the position of systolic and diastolic blood pressure. According to the measured pulse wave amplitude and the corresponding static pressure, the systolic pressure Ps, the diastolic pressure Pd and the average pressure Pm can be obtained. Generally, the amplitude coefficient of systolic blood pressure is 0.46 ~ 0.64, and the amplitude coefficient of diastolic blood pressure is 0.43 ~ 0.73. 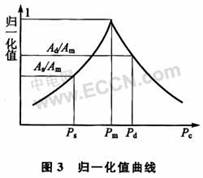
Determination of the systolic blood pressure criterion: during the rising section of the pulse wave amplitude envelope during inflation, when the ratio of the amplitude Ui of a certain pulse wave to the maximum amplitude Um Ui / Um = Ks, the corresponding gas sleeve is considered at this time The pressure is systolic pressure. That is, Ps = P∣Ui = Ks · Um.
Determination of the diastolic pressure criterion: when the ratio of the amplitude Ui of a certain pulse wave to the maximum amplitude Um Ui / Um = Kd in the descending section of the envelope of the pulse wave amplitude, the corresponding gas sleeve pressure at this time is considered to be diastolic Pressure. That is, Pd = P∣Ui = Kd · Um.
Heart rate refers to the number of times the heart beats per minute. Since the heart and the pulse are consistent, the heart rate can be measured while measuring the blood pressure. The key to measuring heart rate is to determine the peak value of the pulse wave, and then calculate the heart rate according to how many pulse waves there are in a certain period of time.
2 System hardware design
2.1 Overall system structure
As shown in Figure 4, the system hardware mainly includes: LM3S1138 Controller, air pump, filter amplifier circuit, alarm circuit, storage module, keyboard module and liquid crystal display module. 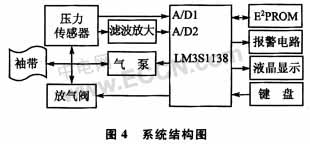
The pneumatic circuit mainly completes the control of the pressure applied to the outside world and the collection of pressure signal data; the amplification filter circuit mainly completes the filtering of the pulse signal from the mixed blood pressure signal and amplifies the pulse signal; the storage module is mainly used for the storage of measurement records; alarm The circuit is used for sound and light alarm prompts under abnormal conditions; the display module is used to display blood pressure measurement data and blood pressure history records; and the keyboard module is used for input of system setting parameters.
2.2 Pneumatic circuit
The pneumatic circuit is composed of a cuff, an air pump, a pressure sensor and a bleed valve, which constitute a four-connected structure. The two signals output by the pressure sensor are connected to the two A / D channels of the main controller to complete the measurement of the static pressure signal and pulse signal; the air pump and the deflation valve are directly controlled by the main controller through the drive chip to complete the charging during the measurement Deflation.
2.2.1 Pressure sensor
The characteristics of human physiological signals are low-frequency small signals, generally in the range of μV ~ mV, the frequency range is 0 ~ 300 Hz, and the signal-to-noise ratio is low, so it is very important to choose a sensor with good performance.
The MPXVS050GP pressure sensor contains signal op amp and signal adjustment functions, has good linearity, the output voltage is proportional to the applied pressure, and can be compensated on-chip, and its temperature compensation feature overcomes the temperature drift problem of semiconductor pressure sensitive devices . It can directly convert the pressure of the arterial blood against the blood vessel wall into an electrical signal of 0 to 4.7 V. The corresponding blood pressure value is 0 to 375 mmHg, which is very suitable for the design requirements of the sphygmomanometer, so it is particularly suitable for oscillometric pressure measurement. Figure 5 shows the linear correspondence between the input and output of the MPXV5050GP pressure sensor. 
2.2.2 Drive circuit design
Figure 6 is the pneumatic circuit drive circuit. The operating drive currents of the HLPM30A air pump and HLV01A solenoid valve are 450 mA and 75 mA, respectively. The signals to control the operation of the air pump and solenoid valve are issued by the LM3S1138 controller, and the digital I / O output current of the LM3S1138 controller cannot meet the requirements. Therefore, in order to provide a suitable driving current for the air pump and the solenoid valve, a Darlington tube ULN2803 drive circuit capable of outputting 500 mA is used to drive the air pump and the solenoid valve, and the first and second ways of the ULN2803 are used to drive the electromagnetic Valves and air pumps. 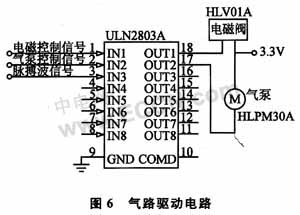
2.2.3 Filter amplifier circuit
The signal from the pressure sensor is a mixed signal of pulse signal and static pressure signal, and it is also mixed with high frequency interference and DC or low frequency components from the outside. The static pressure signal is a low-frequency signal, the frequency is less than or equal to 0.04 Hz, and the pulse signal frequency is generally about 1 Hz. Although the selected pressure sensor has an amplification function, the amplification of the pulse oscillation signal is limited, so it is mainly a static pressure signal. The mixed signal is divided into two parts and connected to the LM3S1138 controller, one way is directly connected to the A / D converter for analog / digital conversion, and the static pressure signal data is obtained; Pulse signal data.
As shown in Figure 7, the filter consists of two RC networks that determine the cutoff frequency. These two cutoff frequencies are calculated by the following formula. 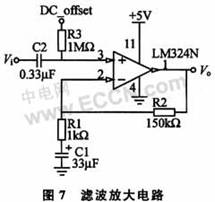
![]()
Considering that the blood pressure and heart rate of hypotensive patients are lower than normal people, and it is necessary to ensure that the interference components are filtered out, so here the pulse wave frequency is set to 0.5 to 5 Hz, so R1 = 1 kΩ, C1 = 33μF, R3 = 1 MΩ , C2 = 0.33μF.
This circuit can not only extract the required pulse signal, but also amplify the weak pulse signal. The strength of the pulse signal varies from person to person, but the general range is 1 to 3 mmHg. According to the transfer function of the pressure sensor MPXV5050GP, the voltage signal converted by this pressure signal is 12 to 36 mV. Since the filter attenuates 10 dB at the 1 Hz signal, the oscillating wave signal becomes 3.8 to 11.4 mV. After experimental testing, the amplifier magnification is set to 150, so that the signal change range is located in the LM3S1138 A / D conversion area with high sensitivity, which can improve the accuracy of data acquisition.
3 System software design
3.1 Main work flow of the system
The main work flow of the system is shown in Figure 8, where the measurement work mode is the default mode. 
In the blood pressure measurement mode, the blood pressure measurement display is completed, and the measured blood pressure data is analyzed. If there is abnormality (high blood pressure, low blood pressure, slow heart rate, fast heart rate, wrong measurement, etc.), an alarm prompt . Alarm conditions:
â‘ Systolic blood pressure> 145 mmHg or systolic blood pressure <95 mmHg;
â‘¡Diastolic blood pressure> 90 mmHg or diastolic blood pressure <45 mmHg;
â‘¢Heart rate> 105 or heart rate <45.
After the measurement is completed, it prompts whether to save the data. The system can store up to 16 groups of data, and each group can store 331 records.
In the viewing and recording operation mode, you can call up 16 sets of blood pressure data lists or generate line charts of daily, weekly, and monthly blood pressure conditions to facilitate further observation and analysis of blood pressure changes in a certain period.
3.2 Blood pressure measurement process
During the collection and processing of blood pressure measurement, there are several important sequences and data. Let the original static pressure signal sequence be {statk_BP [i], i = 0, 1, ..., n-1), and the pulse signal sequence {pluse_BP [i], i = 0, 1, ..., n-1}. After normalization, the peak sequence {peak_BP [i], i = 0, 1, ..., n-1}, the maximum value in the peak envelope is max_peak. The peak time interval sequence is {TIme_peak [i], i = 0, 1, ..., n-1).
As shown in Figure 9, in the measurement mode, the air pump is automatically pressurized to inflate. When the pressure in the cuff is greater than or equal to 200 mmHg and no pulse signal appears, the inflation is stopped and the gas in the cuff is slowly released. The pulse signal value is collected every 5 ms. After detecting the first peak, the pulse signal value and the static pressure signal value are collected at a period of 5 ms to obtain the static pressure signal sequence staTIc_BP [i] and the pulse signal sequence pluse_BP [i], and determine whether the collected pulse signal value is a peak value. If it is a peak, record the pulse signal value and static pressure signal value at this time, and the time difference from the last peak to the current time, and generate a sequence peak sequence peak_BP [i] and a peak time interval sequence TIme_peak [i], respectively. Generally, when the cuff pressure Pc ≤ 60 mmHg, the peak of the pulse signal disappears. When the peak of the pulse signal cannot be detected within 4 consecutive seconds, the system exits this blood pressure measurement. 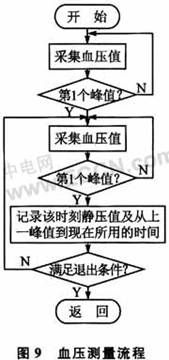
3.3 Blood pressure and heart rate calculation process
There is no perfect theoretical derivation of oscillometric blood pressure measurement, so that the determination of feature points can only rely on the statistical induction of collected samples. Therefore, oscillometric blood pressure measurement is based on statistical methods and has a certain degree of dispersion. As shown in FIG. 10, the data processing process mainly includes four important parts: filtering processing, calculation of heartbeat cycle, determination of average pressure position, calculation of systolic pressure and diastolic pressure. 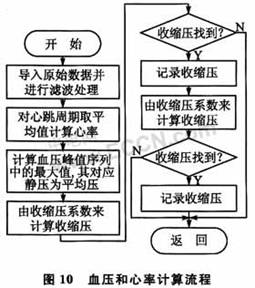
The filtering process is mainly used for filtering and optimizing the noise removal processing of the data with large adjacent jumps in the peak sequence peak_BP [i], and increasing the linearity of the original data.
Heartbeat cycle refers to the time interval between two pulse wave peaks. In order to improve the accuracy of the results, the arithmetic mean of the peak time interval sequence TIme_peak [i] during the deflation process is used to obtain the average period Ta, then the heart rate is R = 1 / Ta.
The average pressure value refers to the static pressure value corresponding to the peak position of the envelope of the pulse signal. By comparing the adjacent data of the peak sequence of the filtering process, the peak value of the pulse signal envelope max_peak = peak_BP [a] can be obtained, then the average pressure value of the blood pressure Pm = static__BP [a].
According to the principle of amplitude coefficient method, Ps / Pm = Ks and Pd / Pm = Kd. Since the position of systolic and diastolic blood pressure in the static pressure curve is determined by the peak envelope of the pulse signal, it can be derived that: peak_BP [b] / max_peak = Ks and peak_BP [c] / max_peak = Kd. The corresponding values ​​of b and c are the positions of systolic and diastolic blood pressure in the static pressure sequence, that is, systolic blood pressure Ps = static_BP [b] and diastolic blood pressure Pd = static_BP [c]. Among them, the amplitude coefficient values ​​commonly used in medical clinics, namely Ks = 0.48, Kd = 0.58.
4 Experimental results and analysis
Select three groups of measurers, use the method of repetition and comparison, and use the electronic sphygmomanometer and mercury sphygmomanometer for continuous measurement in the same period, and compare and analyze the measurement results to observe the consistency of the measurement results And accuracy, as listed in Table 1. 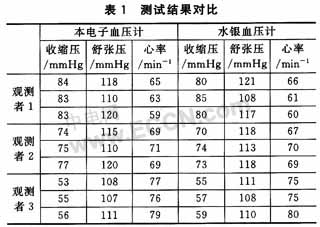
It can be seen from the experimental data in Table 1 that the measurement results of this electronic sphygmomanometer are basically consistent with mercury blood pressure, blood pressure error range <6 mmHg, heart rate error range <3 times / min, so it can be used in clinical diagnosis and home healthcare .
PMG Permanent Magnet Wind Turbine, PMG Permanent Magnet Wind Generator, PMG Permanent Magnet Wind Mill, PMG Permanent Magnet Windmill, PMG Permanent Magnet Wind Alternator, VAWT Vertical Wind Turbine, VAWT Vertical Wind Generator, VAWT Vertical Windmill, VAWT Vertical Wind Alternator, VAWT Vertical Wind Mill
Permanent Magnet Wind Turbine, PMG Wind Generator, VAWT Wind Generator, Vertical Wind Turbine
Delight Eco Energy Supplies Co., Ltd. , https://www.cndelight.com