On-demand heart rate estimation algorithm based on MUSIC
Imagine the world in the decades to come. Your grandchildren may not know the word hospital. All health information is recorded and monitored remotely by sensors. Imagine your home is equipped with different sensors to measure air quality, temperature, noise, light and air pressure, and based on your personal health information, the system adjusts the relevant environmental parameters to optimize your home environment. On the road to a better future, ADI is in a unique vantage point to increase its share of the digital health market by providing complementary sensors, software, and algorithms.
Heart rate (HR) monitoring is a key feature of many existing wearable products and clinical devices. These devices generally measure photoplethysmography (PPG) signals. To obtain this signal, LEDs must be used to illuminate human skin, and then photodiodes are used to measure changes in reflected light intensity caused by blood flow. The PPG signal morphology is similar to the arterial blood pressure (ABP) waveform, making this signal a non-invasive heart rate monitoring tool popular with the scientific community. The periodicity of the PPG signal corresponds to the heart rhythm. Therefore, the heart rate can be estimated from the PPG signal. However, heart rate estimation performance is reduced by poor blood perfusion, ambient light and, most importantly, movement artifacts (MA) 1 . The industry has proposed a number of signal processing techniques to eliminate MA noise, including Analog Devices' motion suppression and frequency tracking algorithms, using a triaxial acceleration sensor placed close to the PPG sensor. When there is no exercise, it is better to have an on-demand algorithm to provide fast and more accurate heart rate estimation to the tracking algorithm. In this paper, the multi-signal classification (MUSIC) frequency estimation algorithm was modified to use ADI's medical health watch platform to achieve high-precision on-demand heart rate estimation based on the PPG signal on the wrist. Figure 1 shows its block diagram. The details of this figure will be described later.
Overview of PPG Signals from ADI Healthcare Watches
When the LED emits light, blood and tissue absorb different amounts of photons, causing the photodetector to detect different results. The photodetector measures the change in blood pulsation and outputs a current which is then amplified and filtered for further analysis.
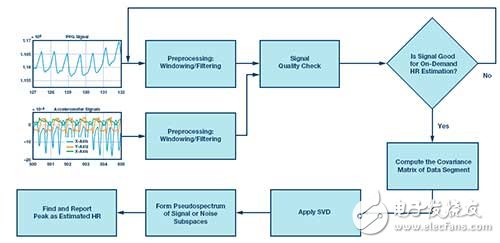
Figure 1. MUSIC based on-demand heart rate estimation algorithm using wrist PPG signals.
Figure 2a shows a generic PPG signal consisting of alternating (ac) and direct (dc) components. The dc component of the PPG waveform detects light signals reflected from tissues, bones, and muscles, as well as the mean blood volume of arterial and venous blood. The AC component represents the change in blood volume that occurs between the systolic and diastolic phases of the cardiac cycle, and the fundamental frequency of the AC component depends on the heart rate. Figure 2b is the PPG signal from the ADPD107 watch, as described in the previous Analog Dialog article. The goal of the ADI multi-sensory watch is to measure multiple vital signs on the human body's wrist. ADI watches have PPG, ECG, EDA, ACC, and temperature sensors. This article focuses only on the PPG and ACC sensors.
Now let's take a closer look at the similarities between the PPG and ABP waveforms. The ABP waveform is due to the left ventricle ejecting blood. The main pressure flows along the systemic vascular network and reaches multiple sites. Significant changes in arterial resistance and compliance cause reflexes. The first site is the junction between the thoracic aorta and the abdominal aorta, which causes the first reflex, commonly referred to as systolic late waves. The second reflex site is the junction between the abdominal aorta and the common iliac artery. The main wave is reflected back again, resulting in a small drop called dicrotic notch, which can be observed between the first and second reflections. There are other smaller reflections that are smoothed out in the PPG signal2. The focus of this article is heart rate estimation, which depends only on the periodicity of the PPG signal. The algorithm does not consider the exact shape of the PPG.
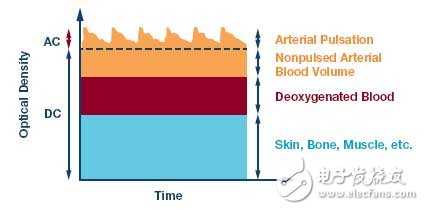
Figure 2a. Typical PPG signal with AC and DC sections
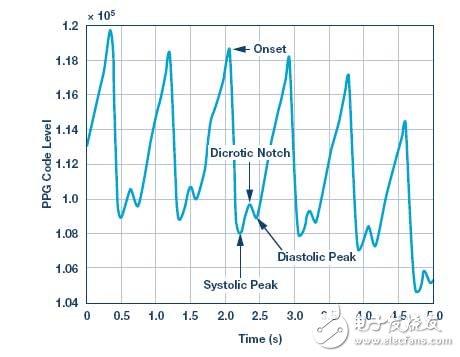
Figure 2b. ADI Healthcare Watch PPG Signal
PPG signal preprocessing
It is well known that PPG signals are susceptible to poor blood perfusion and motion artifacts in peripheral tissues1. In order to minimize the impact of these factors so as not to interfere with subsequent PPG analysis and heart rate estimation, there is a pre-processing phase. A band-pass filter is required to eliminate high-frequency components (such as power supply) and low-frequency components (such as changes in capillary density and venous blood volume, temperature change, etc.) of the PPG signal. Figure 3a shows the filtered PPG signal. Use a set of signal quality indicators to find the first window of the PPG signal suitable for the on-demand algorithm. The first check involves ACC data and PPG signals to determine if a piece of motionless data can be detected and then measure other signal quality indicators. If there are movements in a specific threshold above the absolute value of ACC data in three directions, the on-demand algorithm rejects the estimation based on such a data window. The next signal quality check is based on some autocorrelation of the data segment features. Figure 3b shows an autocorrelation example of the filtered PPG signal. The autocorrelation of the acceptable signal segment exhibits the following characteristics: having at least one local peak, and no peak exceeding a certain number corresponding to the highest possible heart rate; local peaks decreasing from high to low, interval time increasing; and some other characteristics. Only the autocorrelation of the interval time corresponding to a meaningful heart rate (in the range of 30 bpm to 220 bpm) is calculated.
When there are enough data segments to pass the quality check continuously, the second phase of the algorithm will use the MUSIC-based algorithm to calculate the accurate heart rate.
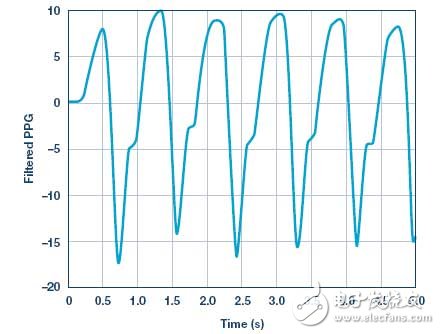
Figure 3a. Bandpass filtered PPG signal in Figure 1b
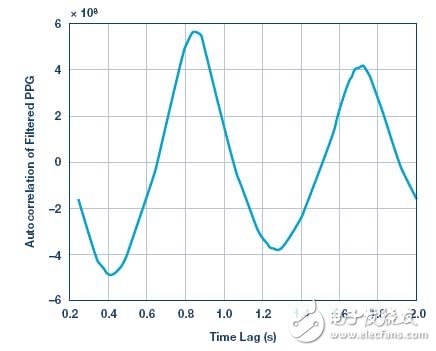
Figure 3b. Autocorrelation of signal diagram in Figure 2a
On-demand heart rate estimation algorithm based on MUSIC
MUSIC is a subspace-based method that uses a harmonic signal model to estimate frequency 3 with high accuracy. The Fourier transform (FT) may not perform well for noise-damaged PPG signals because we need a high resolution heart rate estimation algorithm. In addition, FT evenly distributes the time-domain noise throughout the frequency domain, which limits the certainty of the estimation. With FT, it is difficult to observe smaller peaks 4 near larger peaks. Therefore, in this study, we used the MUSIC-based algorithm for frequency estimation of heart rate. The key idea behind MUSIC is that the noise subspace is orthogonal to the signal subspace, so the zero of the noise subspace will indicate the signal frequency. The following steps are a summary of this heart rate estimation algorithm:
• Remove the average and linear trends from the data
• Calculate the covariance matrix of the data
• Applying singular value decomposition (SVD) to covariance matrices
• Calculate signal subspace order
• Form pseudo-spectrum of signal or noise subspace
• Find out the peak of MUSIC pseudospectral as heart rate estimate
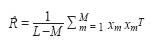
MUSIC must apply singular value decomposition and must search for spectral peaks over the entire frequency range. Let's look at some mathematical formulas to make the above steps clearer. Assume that the filtered PPG signal has a window of length m expressed as xm and m≤L (where L is the total number of filtered PPG signals in a given window). Then, the first step is to form a sample covariance matrix, as follows:
Then apply SVD to the sample covariance matrix as follows:
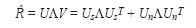
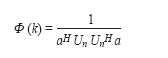
Where U is the left eigenvector of the covariance matrix, Λ is the diagonal matrix of the eigenvalues, and V is the right eigenvector. The subscripts s and n represent the signal and noise subspaces, respectively. As mentioned earlier, using the signal has passed the prior knowledge of the signal quality checking stage, the MUSIC-based algorithm is modified for heart rate estimation, so after the preprocessing step, the only frequency component present in the signal is the heart rate frequency. Then form the signal and noise subspace, assuming that the model order contains only a single tone, as shown below:
Us = U(1: p, :); Un = U(p + 1: end, :)
Us = U(1: p, :); Un = U(p+ 1: end, :)
Where p = 2 is the number of models. Only consider frequencies within the meaningful heart rate limit. This will greatly reduce the amount of computation and make real-time implementation of embedded algorithms possible. The search frequency vector is defined as:
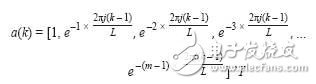
Where k is the frequency within the heart rate target frequency range and L is the window length of the data in xm (t). Then, the following pseudospectrum uses the noise subspace feature vector to find the MUSIC peak, as shown below.
4, which shows a sharp peak at 1.96 Hz, and which translates to 117.6 bpm HR.
The term pseudo-spectrum is used here because it shows that there is a sinusoidal component in the signal under study, but it is not a true power spectral density. Figure 4 shows an example of a 5-second data window based on the MUSIC-based algorithm. There is a very steep peak at 1.96 Hz and the heart rate is 117.6 bpm.
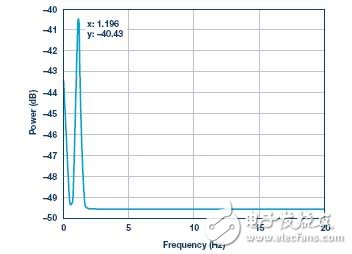
Figure 4. An example of MUSIC-based estimation using PPG data
Results of the On-demand Heart Rate Estimation Algorithm Based on MUSIC
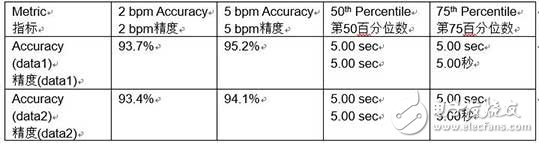
We have tested the performance of the algorithm on a data set containing 1289 test cases (data1) and the test object was asked to be stationary at the beginning of the data. Table 1 shows the results based on the MUSIC algorithm and indicates whether the estimated heart rate is within the 2 bpm and 5 bpm accuracy of the reference (ECG), and the 50th percentile (median) and 75th percentile of the estimated time. Quantile. The second row in Table 1 shows the performance of the algorithm when there are periodic movements (eg, walking, jogging, running) for a data set containing 298 test cases (data2). By detecting motion, the algorithm is considered successful if either data is deemed unreliable and rejected, or if it is thought that the heart rate is accurately estimated without being influenced by the motion. In terms of memory usage, assuming a buffer size of 500 (5 seconds at 100 Hz), for the target frequency range (30 bpm to 220 bpm), the total memory required is approximately 3.4 kB, which takes 2.83 cycles per call.
Table 1. Performance values ​​of the on-demand heart rate estimation algorithm based on MUSIC
Conclusion
The MUSIC-based on-demand algorithm is one of many algorithms proposed by the vital sign monitoring team in the healthcare business unit of Analog Devices. The on-demand algorithm used in our medical health watch is different from the MUSIC-based approach discussed here, the former being less computationally expensive. Analog Devices provides software and algorithmic capabilities for sensor (embedded) and edge nodes, allowing it to extract valuable information from the data and send only the most important data to the cloud, allowing our customers and partners to make it locally decision making. The standard we choose to apply is that the results are very important to our customers and we have unique measurement expertise. This article is just a brief introduction to the algorithm developed by Analog Devices. With our existing expertise in sensor design and our efforts in biomedical algorithm development (including embedded and cloud computing), ADI will have unique advantages to provide the most advanced algorithms for the global medical health market and software.
Firewall Pc With Tpm,Firewall Router With Tpm,Pfsense Firewall With Tpm,Network Server With Tpm
Shenzhen Innovative Cloud Computer Co., Ltd. , https://www.xcypc.com